 Over the years there have been many urban legends created surrounding the idea of correlation. Yet so many clearly have no logical connection when it comes to causation. One of the attributes that makes TTI Success Insights leaders in the field of assessment solutions is the countless hours our research team spends on reliability and validity studies. To that end, we’ve become well versed in understanding correlation and causation and have an intricate understanding of when they are or are not related.
As an example of correlation without causation, there is a Wikipedia page for something called the Super Bowl Indicator. The page calls the Super Bowl Indicator a “superstition that says that the stock market’s performance in a given year may be predicted based on the outcome of the Super Bowl” played during that year. The superstition says that if an American Football Conference team wins, the following year will be a down market, and the opposite holds true if the National Football Conference team wins. According to the Wikipedia page, the indicator has been correct 40 of 50 times as of January 1, 2017. On the surface, that’s an 80% correlation!
Some other very unique relationships exist in the world around us. Many interesting examples are provided on the spurious correlations website, where the author generates graphs of thousands of correlations that are not what they purport to be on the surface. For example, the following chart shows a strong correlation of 0.94 between the number of honey producing bee colonies in the United States versus the marriage rate in Vermont. Correlation this high indicates that the two data sets being compared are strongly related. In other words, this particular correlation tells us that honey bee productivity is a nearly perfect predictor of people getting married in Vermont.
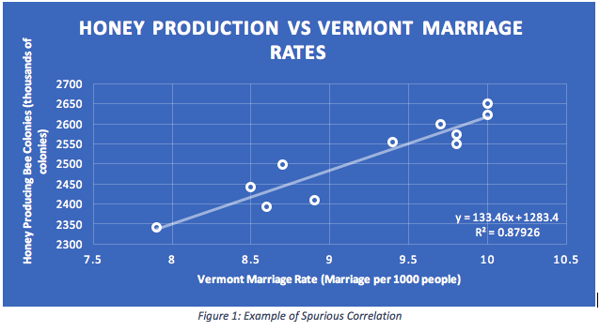
This is a quite absurd example demonstrating a common problem when it comes to interpreting correlation. The adage states that correlation does not imply causation. Obviously, there is no logical way that the fall off of honey production across the U.S. will negatively impact the marriage rates of people living in Vermont.
Mistake #1: Assuming Correlation Implies Causation
Causation, by definition, implies that one event is the result of another event occurring. Correlation is a statistical measure of the (linear) relationship between two variables. If one has data on any two variables, one may compute the correlation between them. Causation, on the other hand, is much more difficult to determine. One may use correlation to establish whether two variables may be related and warrant further exploration into whether there is a valid causal relationship.
As already mentioned, establishing a causal relationship between two variables is quite challenging. An example of how to establish causation may be taken from the field of medical research. Most individuals have heard of the placebo effect. This process has historically been used in testing new medication. A group of individuals with nearly identical characteristics (and/or symptoms) is split into two (or more) groups. One group is given the new medication and one is given a placebo. A study is conducted to determine the medicine’s effectiveness. If the medication is successful and the placebo effect is negligible, one may begin to assume a causal relationship exists between the new medication and the effects of the disease or illness in the group.
Mistake #2: Misinterpreting Correlation
One area people often make mistakes when interpreting correlation is that correlation implies a linear relationship between the variables of interest. To show a simple example, consider the following table. If one decided to compute the correlation between the variables x and y, one would find a correlation of 0.86 between these variables.
Table 1: Simple Example of Incorrect Relationship
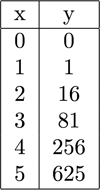
It would be a mistake to stop at this point and assume that these two variables are linearly related. Clearly they have some linear relationship. However, the true relationship between these two variables is y = x4, not the 0.86 that the math originally implied. The moral of the story here is that just computing a correlation coefficient may give one a false read on the true relationship between variables.
Mistake #3: Over-generalization
Another common mistake regarding correlation is to over-generalize. I come from a mathematics background, writing my dissertation on the topic of algebraic combinatorics. To me, levels of correlation dropping below 0.50 struggle to show a relationship. I will generally not keep an explanatory variable in a modeling exercise if the correlation between it and the response variable falls below 0.40.
In the social sciences, where I now find myself doing research, correlations at or above 0.25 or 0.30 are considered to show potential evidence of a relationship. With my math background, I find correlation numbers that low difficult to accept.
For now, I’ll leave the argument over whether that is a realistic assumption and go in a slightly different direction. Referring to the lower right hand corner of Figure 1 above, there is an equation that looks like:
y = 133.46x + 1283.4
R2 = 0.87926
This represents the regression equation generated from the correlation between the honey bee production and the marriage rates in Vermont. In this case, by regression equation we mean using the data that generated Figure 1 above to compute the a and b that best fit the equation y = a + b*x. R2 gives us an indication of how good this fit is. The closer R2 is to 1, the better the equation describes the relationship between the two variables.
Earlier I stated that the correlation between these two variables is 0.94, indicating a strong correlation. To be exact, the correlation between these variables is 0.9376893959. If I use basic mathematical principles and square this value I get 0.8792614032, which leads me to the square of the correlation coefficient, commonly known as R2 (as seen in the figure above).
The relationship here is that the R2 value represents the (linear) variance explained by the correlation. Linear variance shows how much the data vary from high to low. Any value less than one implies that some of the variance is due to random effects. The takeaway for the statistical layperson is that R2 is a measure of how strong a linear relationship between two variables is and it is computed by squaring the correlation coefficient.
In the case of a correlation of, say, 0.30, that correlation explains 9% (0.302 = 0.09) of the variance. In other words, 91% of the variance is due to random effects.
Possibly the biggest mistake is over-generalizing the results of a correlation coefficient. If someone is happy explaining only 9% of the variance between two variables (or not explaining 91%), then accepting correlation at levels of 0.30 as good is ok.
Where you go from here
Strong correlation may be misleading and keep one from asking more in depth questions. Immediately seeing strong correlation between two variables may lead one to work under the assumption of a linear relationship when a deeper construct lies below the surface waiting to be released.
Your takeaway is this: be aware of misuse of certain statistical terms. For example, if someone says that the correlation between two variables is statistically significant, this is only the first step in determining causality.
A calculation being “statistically significant” means the calculation can be trusted to the level of significance being reported (usually reported at the 95% confidence level). This does not mean the correlation itself is significant. Do not fall victim to a poor choice of words and misuse the phrasing.
Conclusion
We’ve highlighted some of the most common mistakes made when working with correlation. It is not appropriate to automatically infer a causal relationship between two variables just because they have a strong correlation coefficient.
Simply stated, correlation does not imply causation. Correlation is merely a computation and is meaningless without further justification, good or bad, about the actual relationship or lack thereof between two variables.