If you’re ever dug into our technical reports, you might be wondering what they are and why they’re so hard to read! I’m here to break down what you need to know.
Our technical reports provide documentation of the process, progress and updated results of our ongoing assessment improvement. All of this is done with the goal of going beyond the requirements of the day-to-day user and making our tools defensible when viewed by assessment experts.
In other words, the intended audience dictates the vocabulary and writing style of our reports, which is why they are academic and can be difficult to interpret.
These requirements are not new. Oscar Buros, who originated the Mental Measurement Yearbook in 1938, included in the forward of his first publication, the following quote.
“Test users have every right to demand that test authors and publishers present full particulars concerning the methods used in constructing and validating the tests which they place on the market. Tests not accompanied by detailed data on their construction, validation, uses, and limitations should be suspect. (pp. xiii–xiv)
To help the public better understand these complex reports, the research team (under the guidance of Dr. Eric Gehrig) has published several assessment protocol white papers, all of which are available here.
What Are the Requirements For Technical Manuals?
Key components of these technical reports require that assessment creators provide reliability and validity evidence. That sounds straight forward until you realize that each of those assessment requirements have several subcomponents.
As a result, our reports must address four areas of reliability:
- Internal Consistency – consistency of responses (same population, same sitting).
- Temporal Consistency – stability of scores across time (for the same population), i.e., correlation.
- Alternate Forms Consistency – different forms of test (for the same population), also correlation.
- Generalizability – generalize all the above, considers the possibility of multiple sources of “random” error.
The same is true of validity, which must include five components:
- Test Content - Theoretical foundation, assessment development, assessment adaptation, content domain, construct relevance, etc.
- Internal Structure – Data agreeing with the content theoretical foundations.
- External Variables – Relationship to the so-called real world
- Response Processing – Does the brain agree with what the test is measuring.
- Consequences of Testing – all possible positive and negative outcomes and any necessary mitigation strategies.
As we expand our assessments into other languages and cultures, TTISI’s global distribution protocols include the International Commission’s Guidelines for Translating and Adapting Assessments guidelines.
To meet these advanced requirements, the primary components for our assessment technical reports follow the American Psychological Association’s guidelines set forth in their three-volume series APA Handbook on Testing and Assessment in Psychology, with cross walks with similar guidelines published by such organizations as the European Federation of Psychologists’ Associations (EFPA) and the British Psychological Society (BPS), the International Test Commission and the Buros Mental Measurement Yearbook.
Why Does It Matter?
While life-long users of our tools know that they work, documentation and transparency is essential to remain a leader in our field.
“ Our technical reports provide documentation of the process, progress and updated results of our ongoing assessment improvement. ”
We must be able or provide this level of detail to gain leverage in an ever more knowledgeable marketplace. Requests for these kinds of data come to the research team almost daily.
In addition, these analyses provide us with insights into our assessment constructs and strength of particular items that leads to continual improvement.
What Are Some Key Takeaways That a General Assessment User Can Use?

While the general construction of our technical reports follows the same guidelines for each of our assessment tools, here are some highlights of the major takeaways from our most recent publication, our DISC behaviors report. Here’s what is included.
1. Detailed Evidence of Both Reliability & Validity
Please note that the word “evidence” is used. This one word is a great example of issues of blending two worlds: the world of business and the world of science.
Science simply cannot speak in absolutes. So, we have evidence, but no “black and white” comments can be made in a scientific document.
2. The History of DISC as Never Before Provided
One of the first things assessment reviews require is a detailed theoretical foundation and the assessment development process employed from the very beginning.
While most of our users might say that our DISC assessment has its foundations in Marston, a critical review of hundreds of behavior related documents, plus a fantastic interview with Peter Turner, uncovered a rich and frankly exciting historical development of our tool never before exposed.
Please take the time to read about the roles of Prescott Lecky, Walter Vernon Clarke, Art Niemann, W. Clement Stone, John Cleaver, John Geier and Bill and David Bonnstetter.
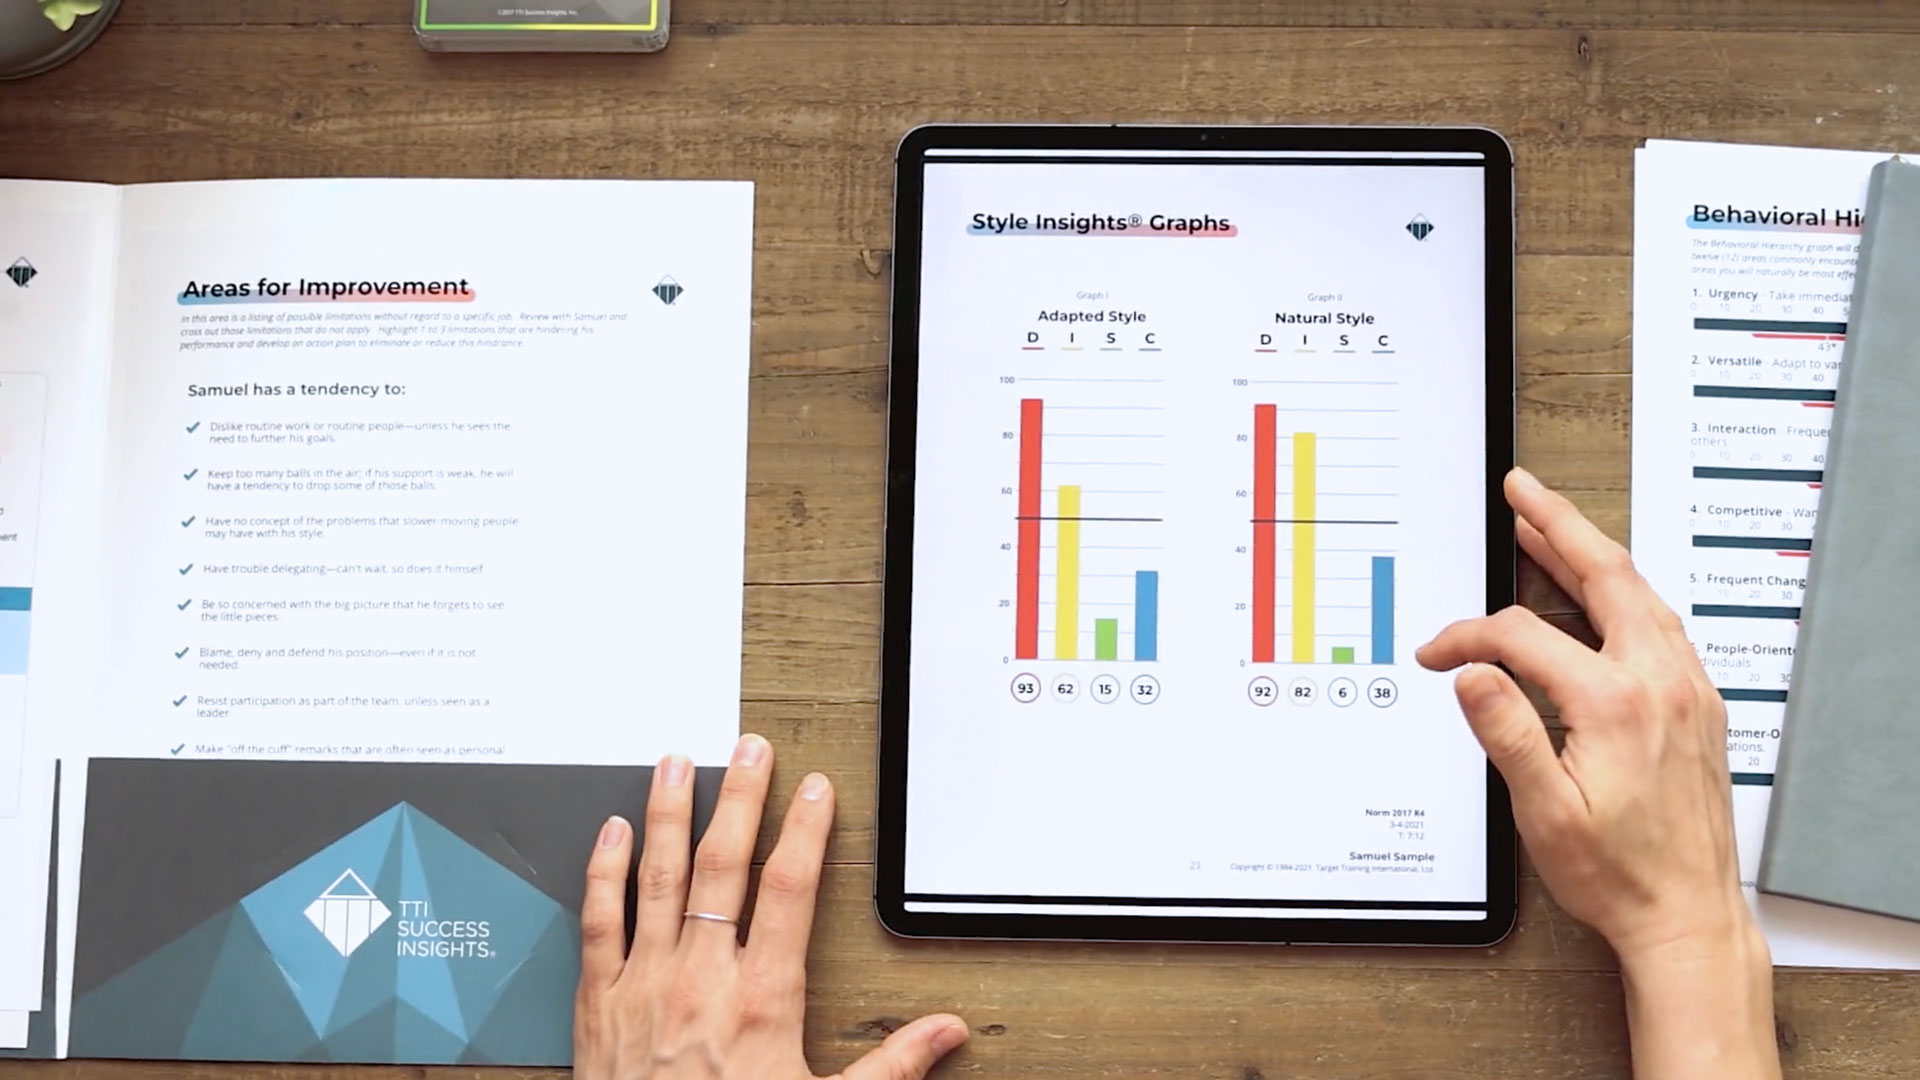
3. An In-Depth Explanation Why TTISI Does Not Use Average Graph Values
Section 2.7 helps differentiate us in the marketplace by clearly showing neurological data. This data explains why a response to what we “like” (responses 1 and 2) is very different from our aversion (responses 3 and 4). This ‘apple and orange’ understanding clearly shows why averaging these scores is inappropriate.
4. The Value of Providing Demographics
As a result of demographic data being collected, we are finally able to show how our assessments may expose unique job-related elements.
Appendix B uses a logistic regression modeling procedure to identify the probability of membership in a job classification, when the group is compared to a random sample of the general assessment population.
At the time of this publication, we had enough data to analyze 184 different jobs. Each of the 184 data tables provides a list of statistically significant key assessment constructs and the value above 0.5, known as the area under the curve (AUC).
Having worked in medical education, I find Table B. 129: Surgeons, particularly interesting and spot on. It does not surprise me that this job grouping would have these two qualities stand out.
| Variable | AUC |
| Negative relationship to: Customer Service, Natural I |
0.62 |
Move Forward With Technical Manual Reports
The vast majority of our users may not need these reports, but everyone in our network does need to be aware of them and recognize the value they provide, both as state-of-the-art documentation and a source of proof for our commitment to transparency and continual improvement.